The Google Analytics Universal data is no longer available, and you can only access reports in GA4. The successor kept the same information value and even expanded it with a new event-based tracking model. Did the approaches to data export remain unchanged as well? Let’s explore this and figure out the best options to import Google Analytics reports to Google Sheets.
How to import data from Google Analytics 4 to Google Sheets
For many years, Google Analytics users have enjoyed a great way to get their data to Google Sheets – the Google Analytics add-on. It’s not working anymore, but it has a replacement. Moreover, it’s not the only option that lets you export Google Analytics 4 data to Google Sheets. Here is what you can consider:
- Coupler.io – It is a reporting automation platform that lets you connect GA4 to Google Sheets and create custom reports. You can select the needed metrics and dimensions to include in your report and schedule exports of this data to spreadsheets. In addition to GA4, Coupler.io supports other sources. This means you can easily create cross-channel reports by combining data from GA4 and Search Console, ad platforms, marketing apps, and so on. By the way, this solution is available as both a web application and a Google Sheets add-on.
- GA4 Reports Builder add-on – This is the replacement of the famous Google Analytics add-on for Google Sheets. It allows you to create and run reports pretty much the same way you did this with its ancestor. It sounds inspiring, but the reality is a bit different. This add-on has a very low rating on Google Workspace Marketplace – 1.7 stars.
- Manual data export – This option is quite straightforward: You can
download your report as CSV…export your GA4 report directly to Google Sheets. However, you’ll have to repeat this manually whenever you want to refresh your records.
How to automate Google Analytics 4 data import to Google Sheets with Coupler.io
You can automate the import of Google Analytics to Google Sheets on a schedule without any coding or advanced manipulation. For this, click Proceed in the form below. We’ve preselected Google Analytics 4 as a source app and Google Sheets as a destination app. If you need, feel free to change the destination.
After that, you only need to complete 3 simple steps:
Step 1. Extract data from Google Analytics
Connect your Google account, and select one of your analytics accounts and GA4 property. Then choose up to 9 dimensions and up to 10 metrics for your report.

Optionally, you can specify the start/end dates for your report, and add a separate row with the total, maximum, and/or minimum values of the selected metric.
Note: If you want to add more metrics/dimensions to your report, you can click Connect one more source and configure it accordingly. Coupler.io allows you to add multiple sources. So you can increase the number of metrics/dimensions to load, or even combine GA4 data with information from other sources like Google Ads, HubSpot, etc.
Step 2. Transform data before loading it to Google Sheets
Before the Google Analytics data is loaded to Google Sheets, you can preview and even transform it. The available transformations include:
- Columns management – you can hide, rename, and reorder columns, and change their data type.
- Calculable columns – you can add new columns using supported calculation formulas.
- Data filtering – you can filter data based on the selected criteria and specified values.
- Data join/append – you can aggregate data from multiple GA4 properties, different applications, and sources.

Step 3. Load data and schedule refresh
For the last step, you need to connect your Google account and select a spreadsheet and a sheet where to load data. You can create a new sheet if you type a new name.
Optionally, specify the first cell/exact cell range for importing data, change the import mode from replace to append and switch on/off other valuable features.
The major feature that you’d likely want to turn on is Automatic data refresh. It allows you to set a schedule to automate importers of Google Analytics data to Google Sheets.
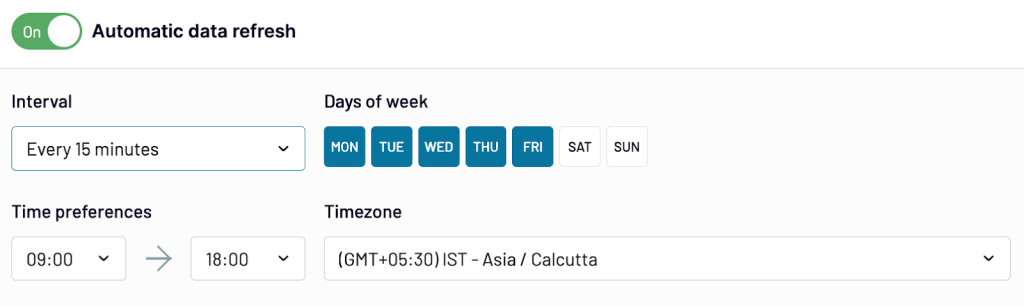
It’s far more efficient and time-saving than exporting reports from GA4 manually. The last thing to do is click the Save and Run button.
Use the Google Sheets add-on to load Google Analytics data
Coupler.io lets you connect GA4 to Google Sheets using either the web app or the add-on. For the latter, you need to install it from Google Workspace Marketplace.
After the installation, run the add-on from the Extensions tab and open its dashboard. Here you will see the active importers and a button to create a new one.
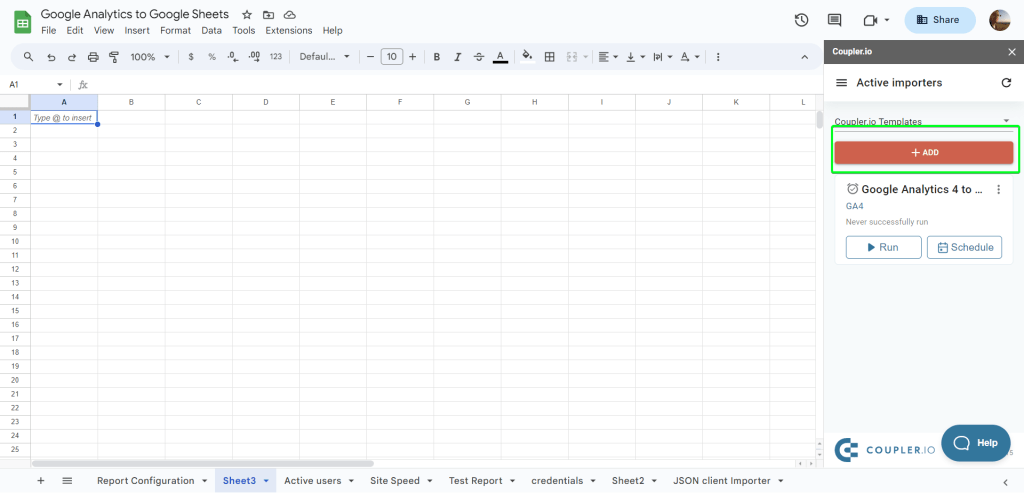
Click on it and complete the setup in the same way as we described above.
How to export Google Analytics to Google Sheets manually
The native export function in Google Analytics is quite simple. Choose the report you need, click Share this report => Download file, and select Export to Google Sheets. Check out our guide on how to export Google Analytics data to learn more.

Once you have selected Google Sheets, you will be asked whether you want to import data to Google Sheets.

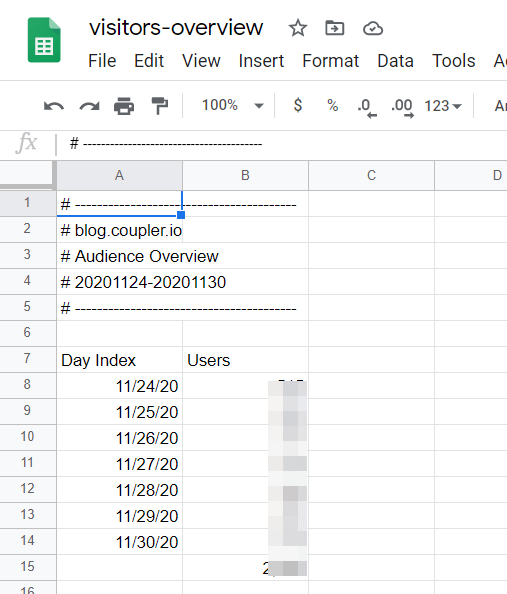
Click Import the data and welcome your Google Analytics report in a new spreadsheet created on your Google Drive. For example, this is what the Audience Overview report looks like in Google Sheets:
Which reports from Google Analytics you can import to Google Sheets
You can export premade and exploration reports. However, for the latter, you’ll need to click the Export data button and select Google Sheets.

Keep in mind that exploration reports may contain several tabs, and you need to export each tab separately.
Here is a list of the standard reports you can import to Google Sheets:
- Reports snapshot
- Lifecycle кeports
- Acquisition reports
- Acquisition overview
- User acquisition
- Traffic acquisition
- User acquisition cohorts
- Engagement reports
- Engagement overview
- Events
- Pages and screens
- Landing page
- Monetization reports
- Monetization overview
- Ecommerce purchases
- In-app purchases
- Purchase journey
- Checkout journey
- Retention reports
- Acquisition reports
- Search Console reports
- Queries
- Google organic search traffic
- User reports
- User attributes reports
- Overview
- Demographic details
- Audiences
- Tech reports
- Overview
- Tech details
- User attributes reports
Note: You can’t export the Realtime report.
How to import Google Analytics reports to Google Sheets using the add-on
The GA4 Reports Builder add-on for Google Sheets has a controversial reputation – its rating is only 1.7 stars.

I also checked out the recent reviews. I can’t say that they are inspiring but people still use this solution. For example, here is one of them:
It does the baseline of what I need. Scheduling is a game changer, it would be 1 star without it…
Considering this is the native and free add-on by Google, let’s check it out. First, you need to install the add-on from the Google Workspace Marketplace. Then grant the required permissions and you’re ready to go! You’ll find the add-on in the Extensions menu of your spreadsheet. Click Create new report.

The dashboard for creating a new GA report will open on the right of your spreadsheet. It contains fields you’ll need to fill out to configure your Google Analytics report.
- Report name – Enter the name of your report
- Account – Select the GA4 account
- Property – Select the GA4 property
- Start/end date – Select the date range for your report

After this section, you’ll need to add more parameters, including dimensions, metrics, and filters for them.
- Metrics include specific measurements, such as New Users, Unique Events, Page Load Time, Sessions, etc.
- Dimensions break down metrics by specific criteria. For example, the New Users metric can include the User Type dimension; the Sessions metric can include the Session duration dimension; and so on.

Click Create Report and the add-on will add a Report Configuration sheet in your Google Sheets doc.
Funny note: I had the Report Configuration sheet from the obsolete Google Analytics add-on. When I clicked Create Report, nothing happened. I clicked again, and then recreated the report by changing the name, dates, metrics, etc. Still no action. And then I realized that I already have this Report Configuration sheet and the add-on has simply added these reports to it. Be attentive not to make my mistake 🙂

How to configure a Google Analytics report on the Report Configuration sheet
A Report Configuration sheet is not the report itself, but the sheet where with your report configuration. If you need to change the configuration of the created report, you’ll have to do this right in the sheet.

Unlike the add-on dashboard with drop-down parameters, here you’ll have to insert parameters manually. So, if you want to add some metrics or change the time range of your report, the Report Configuration sheet is the only place where you can do this.
To create additional reports, you’ll have to repeat the steps described above; or, just fill out the parameters in the respective cells in the next column to the right. The configuration of each new report will be added as a new column on the Report Configuration sheet.
Let’s check out which parameters you can configure.
Report Name [Required parameter]
You can change the name of your report.
Property ID [Required parameter]
You can change the Google Analytics view of your report.
Start Date/End Date [Required parameter]
By default, the start and end dates in a new report have the following values:
- Start Date=
30daysAgo - End Date=
yesterday
You can change these values using one of the following options:
- YYYY-MM-DD format, for example
2020-10-23 - Relative date such as
today,yesterday, orNdaysAgo(Ncan be only a positive integer) - One of the Google Sheets date functions to return the date value automatically. For example, this formula
=EDATE(TODAY(), -1)will return the month ago date, and this formula=EOMONTH(TODAY(), -1)will return the last day of the previous month.
Metrics [Required parameter]
Enter the IDs of the metrics to query in your report. Separate them using commas; or enter each metric ID on a new line. For example,
newUsers, bounceRate We advise you to use a Google Analytics tool called Dimensions & Metrics Explorer. It lists and describes all possible options, and excludes the dimensions and metrics that cannot be queried together. For example, if you choose the metric 7 Day Active User, such dimensions as User Type or User Bucket, as well as metrics Users and Number of Sessions per User become inactive.
Dimensions [Required parameter]
You can enter the IDs of dimensions to query in your report. Separate them using commas, or enter each dimension ID on a new line. For example,
fullPageUrl, pageLocation Dimensions & Metrics Explorer will help you here as well.
Metric and dimension filters [Optional parameter]
You can specify conditions to filter out a dimension or metric in your Google Analytics report. This will let you exclude the rows that you don’t need in the report. Use the following syntax to tailor a filter query:
{metric/dimension} {operator} {expression}{metric/dimension}– name of a metric or dimension to filter. For example,sessions,userType, etc.{operator}– a symbol that defines the type of filter to use. There are six operators for metrics and six operators for dimensions.{expression}– a case-insensitive regular expression that can not be longer than 128 characters. For example,^New*is the regular expression for strings starting withNew.
Operators for metrics
| Operator | Description | Filter example |
== | Equal to | averageSessionDuration==10 |
!= | Not equal to | averageSessionDuration!=10 |
> | Greater than | averageSessionDuration>10 |
< | Less than | averageSessionDuration<10 |
>= | Greater than or equal to | averageSessionDuration>=10 |
<= | Less than or equal to | averageSessionDuration<=10 |
Operators for dimensions
| Operator | Description | Filter example |
== | Exact match | country==USA |
!= | Does not match | country!=USA |
=@ | Contains substring | city=@New |
!@ | Does not contain substring | city!@New |
=~ | Contains a match for the regular expression | city=~^New* (regular expression is the city starts with New) |
!~ | Does not match the regular expression | city!~^New* (regular expression is the city starts with New) |
Multiple filters
If you need to apply multiple filters using OR logic, separate the filters using a comma (,). For example, to filter out by countries either Germany or France, use
country==Germany,country==FranceIf you need to apply multiple filters using AND logic, separate the filters using a semicolon (;). For example, to filter out by countries Germany and France, use
country==Germany;country==FranceOrder [Optional parameter]
You can specify the sorting order by column and direction. To sort by column, enter the metric/dimension IDs in the order you want them to return. For example,
sessions, newUsers– the Sessions metric goes first
newUsers, sessions – the New users metric goes first
The sort order direction is ascending by default. To change the direction to descending, use a minus sign (-) prefix on the field you want. For example,
sessions, newUsers – the Sessions metric will return in the ascending direction
-sessions, newUsers – the Sessions metric will return in the descending direction
Limit [Optional parameter]
You can specify the maximum number of rows to return for your GA report. The default value is 1000. This parameter is recommended to use for reports that return thousands or millions of rows. If you leave this field blank, the add-on will make queries until all rows are returned (this can waste your API quota, which is 50,000 requests per project per day).
Spreadsheet URL [Optional parameter]
You can import the GA report to an external Google Sheets document. To do this, specify the spreadsheet URL in this field and make sure that you have edit permissions for it. By default, the report will be imported to the current Google Sheets document.
Skip Report [Optional parameter]
You can skip the import of a certain report or reports if you enter TRUE for this parameter. This option is useful when you have multiple reports and do not need to import all of them.
You can also apply Google Sheets formulas to set up this field. For example, the following expression will return TRUE (skip the report), if the value in B5 cell is less than 10:
=IF(B5 < 10, TRUE, FALSE)
Get data from Google Analytics to Google Sheets
Once you’ve configured your GA report, you can run it manually. Go to the Extensions menu => GA4 Reports Builder => Run reports

Your Google Analytics report will be imported into a new sheet named accordingly.

How to schedule exports of Google Analytics reports into Google Sheets
The best thing about the add-on is that you can automate data import from Google Analytics to Google Sheets. For this, navigate to your usual path, go to the Extensions menu => GA4 Reports Builder, and select Schedule Reports.
Then select the wanted frequency. The add-on can refresh your reports every month, week, day, and hour. Also, specify the hour for the data updates. Click Save and that’s it. All your configured reports will be imported according to the specified schedule!

Click Save and that’s it. All your configured reports will be imported according to the specified schedule!
How to remove reports from the schedule
If you need to ignore some of the created reports, you can either use the Skip Report parameter or simply delete all the data from the respective columns of your reports. After that, they won’t be available.
Google Analytics in Google Sheets: Combine your reports with other imported data
Having your GA data in spreadsheets opens wide opportunities for processing. You can monitor website performance, create custom dashboards, sales trackers or monitors, as well as visualize data in the way you need.
The add-on only imports data from Google Analytics. However, if you use Coupler.io, you can import data to Google Sheets from other sources, such as Search Console, Google Ads, LinkedIn Ads, and more. This allows you to combine GA4 data with other information to create cross-channel reports.
For example, you can create an SEO performance report that aggregates data from Google Analytics and Google Search Console. To do this, you need to:
- Connect your GA4 and Search Console Accounts.
- Join data based on page URLs in a few clicks in the Transform section.
- Choose the needed metrics for your report
- Load the report to Google Sheets
Here is what this report can look like.

What’s the best part of it? You can schedule automatic updates of the date. Create the report once, and Coupler.io will keep it fresh forever. With weekly, daily, or even hourly updates.
If you’re interested in your search data, Coupler.io also features a handy Google Search Console to Google Sheets integration.
What is the best option to connect Google Analytics to Google Sheets?
Manual export of GA4 reports is a go-to method if you need to quickly share data with your team. It’s simple and won’t take much time to complete. However, it’s not a fit for recurring reporting when you need to update the data in the report every day.
For the automated Google Analytics reporting, you should consider either the dedicated add-on or Coupler.io. If you don’t need any other data for your analytics except for GA4, the add-on would probably be your best option. It’s free and even lets you schedule reports.
However, for more advanced reports and dashboards, Coupler.io is a top solution. It supports 70+ app sources, the data from which you can merge and transform easily within the UI. Automate the refresh of your report with a few clicks to ensure your stakeholders always access the most recent data. Besides, Coupler.io lets you export GA4 data to other destinations, for instance, connect GA4 with Looker Studio. Give it a try right now.
Automate GA4 data export with Coupler.io
Get started for free